Portugal
 Spain
Spain Italy
Italy Greece
 Grenada Citizenship by Investment
Choosing the best country to live in has never been more relevant. Every year, millions of people consider relocating abroad, some in search of better job opportunities, others chasing affordability, safety, or a healthier work-life balance. At the same time, countries themselves are competing to attract global talent, digital nomads, and retirees, creating a wave of new visas and residency options.
However, the concept of "best" is not universally applicable. For a student, the best country might mean affordable universities and a lively cultural scene. For families, it’s safe streets, excellent schools, and generous parental leave. Retirees often prioritise healthcare and the cost of living, whereas digital nomads want strong Wi-Fi and flexible visas.
That’s why the right destination depends on a careful blend of quality of life metrics, happiness, safety, healthcare, education, affordability, and the practical question: Can I actually move there?
To answer that, we’ve gone beyond simple listicles. In this guide, we combine insights from respected international indices, such as the World Happiness Report, the UN Human Development Index, and the Global Peace Index, with our own Global Liveability Score designed for real movers.
This score rates a country's liveability and accessibility via residence permits and visas. After all, a paradise on paper is no use if it’s impossible to relocate there.
What Are the Best Countries to Live in for Quality of Life?
Before diving into the Top 10, it’s useful to step back and look at the wider global picture. That’s why we’ve built a ranking of the Top 50 countries based on happiness, human development, and peace.
This table gives you a clear overview of how countries perform side by side, shows why the usual Nordic leaders stand out, and also reveals some surprising contenders.
| Rank | Country | QoL Score | WHR Rank (2025) | HDI Rank (2025) |
|---|---|---|---|---|
| 1 |  Finland Finland | 87.7 | 1 | 12 |
| 2 |  Denmark Denmark | 85.6 | 2 | 4 |
| 3 |  Iceland Iceland | 85.1 | 3 | 1 |
| 4 |  Sweden Sweden | 84.9 | 4 | 5 |
| 5 |  Netherlands Netherlands | 84.6 | 5 | 8 |
| 6 |  Costa Rica Costa Rica | 84.2 | 6 | 62 |
| 7 |  Norway Norway | 83.9 | 7 | 2 |
| 8 |  Israel Israel | 83.5 | 8 | 27 |
| 9 |  Luxembourg Luxembourg | 83.1 | 9 | 25 |
| 10 |  Mexico Mexico | 82.8 | 10 | 81 |
| 11 |  Australia Australia | 82.4 | 11 | 7 |
| 12 |  New Zealand New Zealand | 82.1 | 12 | 17 |
| 13 |  Switzerland Switzerland | 81.9 | 13 | 2 |
| 14 |  Belgium Belgium | 81.5 | 14 | 10 |
| 15 |  Ireland Ireland | 81.2 | 15 | 11 |
| 16 |  Lithuania Lithuania | 80.8 | 16 | 39 |
| 17 |  Austria Austria | 80.5 | 17 | 22 |
| 18 |  Canada Canada | 80.2 | 18 | 16 |
| 19 |  Slovenia Slovenia | 79.9 | 19 | 21 |
| 20 |  Czechia Czechia | 79.7 | 20 | 29 |
| 21 |  UAE UAE | 79.4 | 21 | 15 |
| 22 |  Germany Germany | 79.1 | 22 | 5 |
| 23 |  UK UK | 78.8 | 23 | 13 |
| 24 |  USA USA | 78.5 | 24 | 17 |
| 25 |  Belize Belize | 78.2 | 25 | 115 |
| 26 |  Poland Poland | 77.9 | 26 | 35 |
| 27 |  Taiwan Taiwan | 77.6 | 27 | - |
| 28 |  Uruguay Uruguay | 77.3 | 28 | 48 |
| 29 |  Kosovo Kosovo | 77.0 | 29 | - |
| 30 |  Kuwait Kuwait | 76.7 | 30 | 52 |
| 31 |  Serbia Serbia | 76.4 | 31 | 62 |
| 32 |  Saudi Arabia Saudi Arabia | 76.1 | 32 | 37 |
| 33 |  France France | 75.8 | 33 | 26 |
| 34 |  Singapore Singapore | 75.5 | 34 | 13 |
| 35 |  Romania Romania | 75.2 | 35 | 55 |
| 36 |  Brazil Brazil | 74.9 | 36 | 84 |
| 37 |  El Salvador El Salvador | 74.6 | 37 | 132 |
| 38 |  Spain Spain | 74.3 | 38 | 28 |
| 39 |  Estonia Estonia | 74.0 | 39 | 36 |
| 40 |  Italy Italy | 73.7 | 40 | 29 |
| 41 |  Panama Panama | 73.4 | 41 | 59 |
| 42 |  Argentina Argentina | 73.1 | 42 | 47 |
| 43 |  Kazakhstan Kazakhstan | 72.8 | 43 | 60 |
| 44 |  Guatemala Guatemala | 72.5 | 44 | 137 |
| 45 |  Chile Chile | 72.2 | 45 | 45 |
| 46 |  Vietnam Vietnam | 71.9 | 46 | 76 |
| 47 |  Nicaragua Nicaragua | 71.6 | 47 | 108 |
| 48 |  Malta Malta | 71.3 | 48 | 24 |
| 49 |  Thailand Thailand | 71.0 | 49 | 76 |
| 50 |  Slovakia Slovakia | 70.7 | 50 | 44 |
Source: World Happiness Report (March 2025) and UNDP Human Development Index (2025/2026 update).
From this broader view, it’s easy to see trends: countries like Finland, Denmark, and Iceland dominate across every metric, while places such as Portugal, Costa Rica, and Singapore emerge as smaller but highly liveable options.
Keeping the overall perspective in mind, let's delve deeper into the Top 10 countries to understand their leading positions and the practicalities of relocating there.
To update your methodology for February 2026, we have aligned the data with the most recent global reports.
The World Happiness Report 2026 will be released on March 20, 2026; current rankings reflect the 2025 report, focusing on the impact of social media on well-being. Meanwhile, the 2025 Global Peace Index and the 2025 Human Development Report (titled "A Matter of Choice: People and Possibilities in the Age of AI") provide the definitive baseline for this year's rankings.
How Did We Rank the Best Countries to Live In?
To go beyond surface-level rankings, we created the Movingto Global Liveability Score, a composite designed specifically for people who are considering not only where life feels good but also where relocation is realistically possible.
Instead of relying on a single source, we blended the world’s three most respected indices with practical, everyday factors that matter to expats:
Together, these elements create a balanced score out of 100. Countries are ranked not just on ideals but on lived reality and practical entry routes.
By comparing our composite with the official indices (Happiness, HDI, GPI), readers can see where the consensus lies, with the Nordics and Switzerland dominating the top rungs, and where our approach adds unique insights. We highlight countries with more accessible visas or lower living expenses that global indices often overlook.
 Finland

Balance of Happiness, Safety, and Nature
Finland has topped the World Happiness Report for eight consecutive years (2018–2025), and it’s not difficult to see why. The country combines a strong social safety net, excellent schools, and universal healthcare with an environment that feels both safe and unspoiled.
Trust in institutions is high, crime is low, and green spaces are woven right into daily life, from forests and lakes to city parks. For expats, this creates a rare mix of security, opportunity, and well-being.
That said, living in Finland comes with a few trade-offs. Winters are long, dark, and often challenging for newcomers. Taxes are among the highest in Europe, and housing in Helsinki can feel pricey compared to the rest of the country.
At first, social interactions may seem reserved, but once you build connections, most Finns are warm. Nonetheless, Finland provides one of the world's most balanced lifestyles for those who are willing to adapt.
Residency Pathways
- EU Blue Card for skilled professionals
- Student visas for higher education (many programs in English)
- Family reunification permits
- Limited Digital Nomad Visa options (emerging policies under EU framework)
Living Snapshot
Rent for a one-bedroom in Helsinki averages €1,000–1,200, while outside the capital it can drop to €700–800.
English is widely spoken, especially in cities, making integration easier for expats. Monthly living costs for a single person typically range from €1,800 to €2,200.
 Denmark
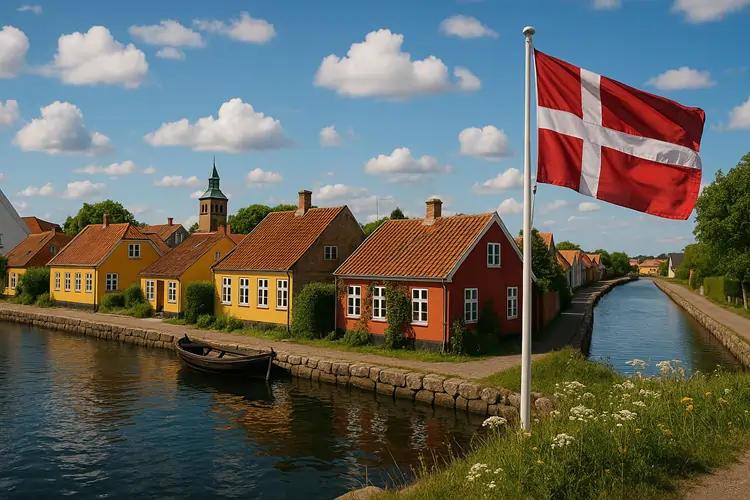
Social Trust and Family-Friendly Living
Denmark is known for its strong welfare system, free healthcare, and affordable childcare, making it one of the most family-friendly countries in the world. Life here is built around balance, short workweeks, excellent public services, and a culture of trust that makes daily life feel smooth and secure.
The trade-offs come with high taxes, steep living costs in Copenhagen, and long grey winters. Yet the generous social benefits, safety, and sense of equality more than compensate, making Denmark a reliable choice for both professionals and families seeking stability.
Residency Pathways
- Work permits for skilled professionals
- Family reunification visas
- Student visas (many courses in English)
- EU Blue Card
Living Snapshot
The rent for a one-bedroom apartment in Copenhagen typically ranges from €1,600 to €2,000, while smaller cities have an average rent of €800 to €1,100.
Nearly everyone speaks English, easing integration. Monthly living costs for a single person are around €2,000–2,400.
 Iceland
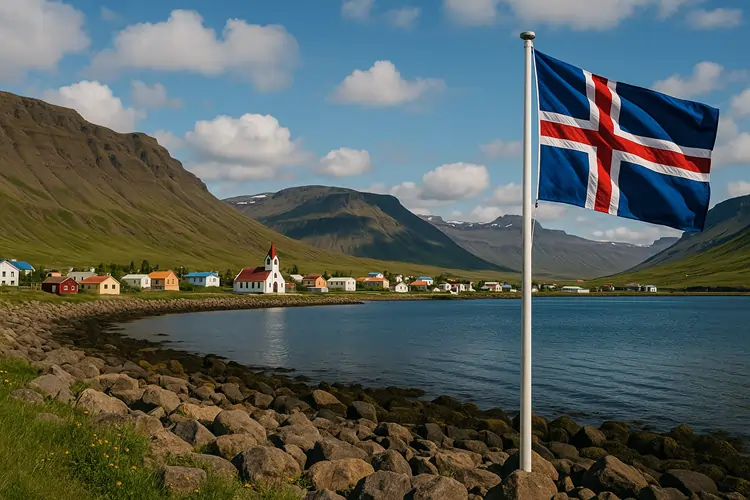
Safety and Natural Beauty
Iceland consistently tops the Global Peace Index, offering an unmatched sense of safety and stability. Its dramatic landscapes, from volcanoes and glaciers to geothermal springs, make daily life feel like an adventure, while strong social systems and a tight-knit community ensure a high quality of life. For many expats, the appeal lies in both the natural beauty and the ease of living in such a peaceful society.
The downsides are its small population, limited job market outside of tourism and energy, and a high cost of living driven by imports. Winters can also feel long and isolating, especially outside Reykjavík.
Still, Iceland’s combination of safety, community, and nature makes it a unique destination for those seeking both tranquillity and adventure.
Residency Pathways
- Work permits (limited to specific industries)
- Student visas for higher education
- EU/EEA citizens enjoy free movement rights
Living Snapshot
Rent for a one-bedroom in Reykjavík ranges from €2,000 to €2,300, with smaller towns closer to €800–1,000. Monthly living costs average €2,200–2,600.
English is widely spoken, though Icelandic is encouraged for deeper integration.
 Sweden
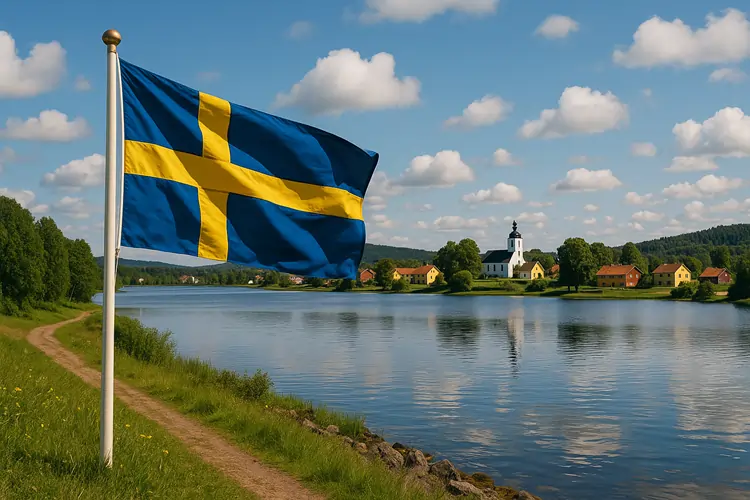
Innovation and Family Benefits
Sweden blends modern innovation with strong social support. Known for its generous parental leave, free healthcare, and excellent education system, it’s one of the best places in Europe for families.
At the same time, Sweden leads in technology, sustainability, and design, offering opportunities for professionals in growing industries. Cities like Stockholm and Gothenburg are vibrant yet well-organised, with English widely spoken and a high standard of living.
Challenges include long, dark winters, high taxes, and a relatively high cost of housing in major cities. Social life may feel reserved at first, but Sweden’s work–life balance, safety, and cultural openness make it a top choice for expats who value both career opportunities and family life.
Residency Pathways
- Skilled worker permits for qualified professionals
- Work permits tied to job offers
- Student visas for higher education
- Family reunification options
Living Snapshot
A one-bedroom apartment in Stockholm averages €1,400–1,700, while smaller cities are closer to €800–1,000.
Monthly living costs for a single person are about €2,000–2,300. English is widely spoken, easing integration, though Swedish helps for long-term residency and employment.
 Norway

Prosperity and Natural Living
Norway combines some of the world’s highest living standards with breathtaking natural surroundings. Strong wages, universal healthcare, and excellent public services make daily life secure and comfortable, while fjords, mountains, and forests provide endless outdoor opportunities. With high levels of equality and trust in society, it’s a country that feels both prosperous and safe.
The flip side is a steep cost of living, especially in Oslo and Bergen, and long winters that can feel challenging. Taxes are high, and housing can be competitive in urban areas. Still, the combination of financial security, social benefits, and access to nature makes Norway one of the most attractive countries for expats who want stability and quality of life.
Residency Pathways
- Skilled worker permits for qualified professionals
- Work permits for non-EU citizens
- Student visas
- Family reunification
Living Snapshot
A one-bedroom apartment in Oslo rents for €1,500–1,800, while smaller towns average €900–1,100. Monthly living costs for a single person are typically €2,200–2,600.
 Switzerland
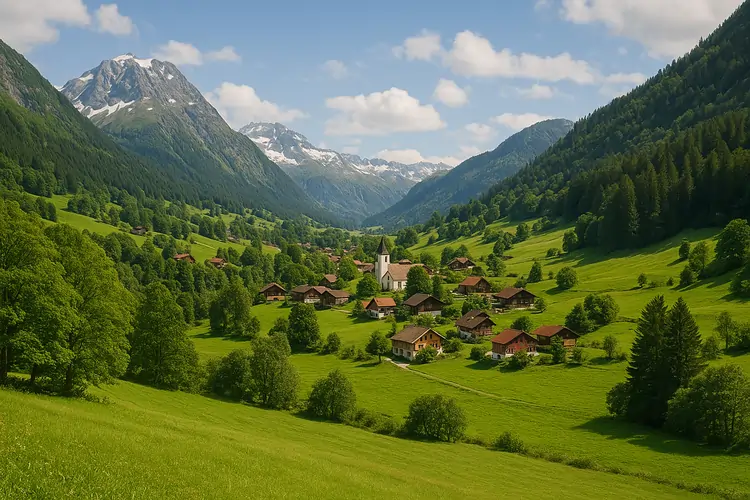
Wealth, Stability, and Scenic Living
Switzerland is world-renowned for its stability, wealth, and pristine landscapes. It consistently ranks high in human development, safety, and healthcare, while offering strong career opportunities in finance, pharmaceuticals, and technology. Cities like Zurich and Geneva are global hubs with excellent infrastructure, and the country’s multilingual culture makes it easier for expats to adapt.
On the other hand, Switzerland is one of the most expensive countries in the world. Rent, healthcare, and daily expenses can quickly add up, and its strict residency rules make long-term settlement challenging. Still, the security, prosperity, and natural beauty make it a top destination for those who can manage the costs.
Residency Pathways
- Work permits for skilled professionals
- Student visas
- Limited family reunification options
- C permits, which grant permanent residency, are available after 10 years of continuous residence for non-EU/EFTA nationals (5 years for some nationalities with integration agreements).
Living Snapshot
Rent for a one-bedroom in Zurich averages €2,500–2,800, with smaller towns closer to €1,200–1,500. Monthly living costs for a single person are about €2,800–3,500. While many Swiss professionals are comfortable speaking English, day-to-day life often requires German, French, or Italian, depending on the region.
 Netherlands
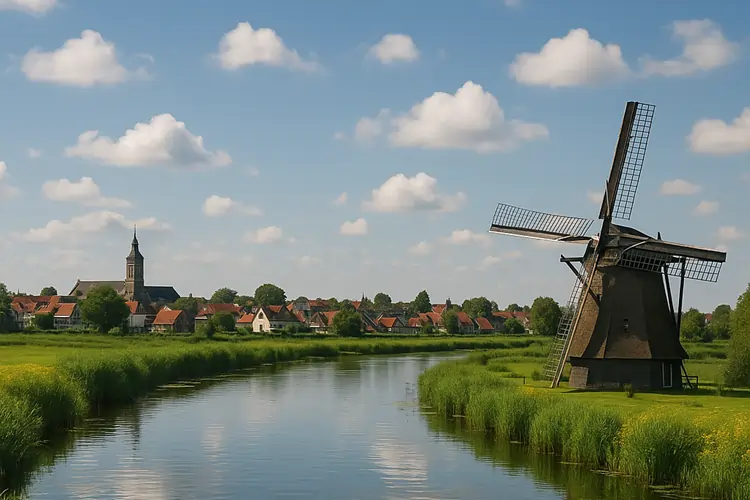
Open Culture and Sustainable Living
The Netherlands stands out for its progressive culture, excellent infrastructure, and high standard of living. With world-class universities, a thriving startup scene, and efficient public transport, it’s a hub for both students and professionals. Its strong cycling culture, emphasis on sustainability, and vibrant cities like Amsterdam and Rotterdam make daily life both dynamic and accessible.
The main challenges are expensive housing in major cities and a high cost of living compared to many other parts of Europe. The climate can also feel damp and grey for much of the year. Still, the country’s openness, strong economy, and welcoming attitude toward foreigners make it one of the easiest places in Europe to settle.
Residency Pathways
- Highly Skilled Migrant visa
- EU Blue Card
- Student visas
- Family reunification options
Living Snapshot
A one-bedroom apartment in Amsterdam costs €2,200–2,500, while in smaller cities it ranges from €900 to €1,200.
On average, living costs €2,200–2,600. English is spoken at an exceptionally high level, and many expats live comfortably without learning Dutch, though picking up the basics helps with long-term integration.
 Luxembourg
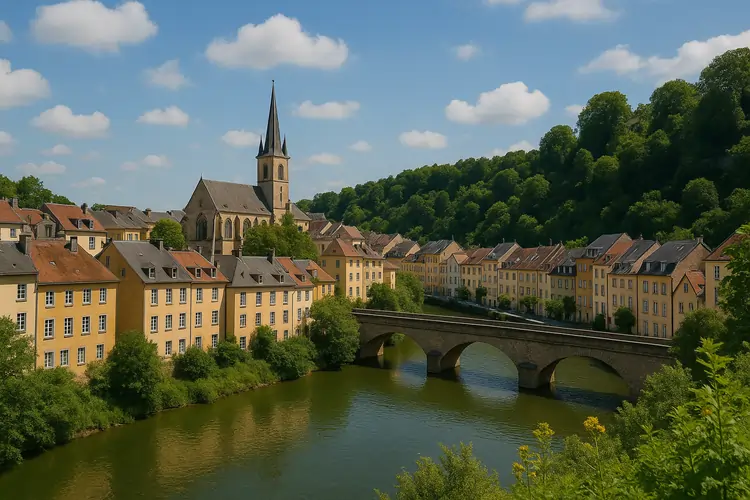
Europe’s Compact Powerhouse
Despite its small size, Luxembourg excels in prosperity and opportunities. With one of the world’s highest GDP per capita levels, it attracts finance, tech, and EU institutions, making it a true international hub.
The country blends old-world charm with modern infrastructure, offering excellent healthcare, safety, and a high standard of living. Its central location in Europe also makes it easy to connect with surrounding countries for work or leisure.
The drawbacks are equally clear: housing is notoriously expensive, and competition for accommodation in Luxembourg City can be fierce. Daily living costs are high, and while the economy is strong, it is also highly specialised, limiting job opportunities outside the financial and EU-related sectors. That said, for expats who secure work, Luxembourg delivers unmatched stability and quality of life.
Residency Pathways
- Skilled worker permits for qualified professionals
- Work permits tied to employment offers
- Student visas
- Family reunification
Living Snapshot
Rent for a one-bedroom apartment in Luxembourg City often runs €1,700–2,200, while smaller towns average €1,200–1,500. Monthly living costs for a single person are typically €2,500–3,000.
With three official languages (Luxembourgish, French, and German), daily life is multilingual, but most residents are used to an international environment, making it relatively easy for newcomers to adjust.
 Australia

Lifestyle and Outdoors
Australia is a perennial favourite for expats, thanks to its sunny climate, laid-back lifestyle, and thriving cities like Sydney and Melbourne. It offers strong universities, a robust healthcare system, and a growing economy with opportunities in sectors like mining, tech, and education.
Add in spectacular natural landscapes, from beaches to the Outback, and it’s easy to see why Australia attracts people seeking both career opportunities and a more relaxed pace of life.
The trade-offs include a high cost of living in major cities, especially housing, and the sheer distance from Europe or North America, which can make travel to and from home challenging. Seasonal climate extremes, from bushfires to hot summers, also take some adjustment. Even so, Australia’s mix of opportunity, lifestyle, and outdoor living keeps it firmly in the top tier.
Residency Pathways
- Skilled Migration visas
- Student visas (popular with international students)
- Family reunification
- Pathways to permanent residency through work or study
Living Snapshot
A one-bedroom in Sydney or Melbourne averages €1,600–2,200, while smaller cities like Adelaide or Perth are more affordable at €1,000–1,300. Monthly living costs for a single person are €2,200–2,700.
With its multicultural population, newcomers generally find integration easy, and English as the main language removes any major barrier.
 Canada

Diversity and Quality of Life
Canada is one of the most welcoming countries for newcomers, known for its diversity, safety, and strong social systems. Its cities, from Toronto and Vancouver to Montreal, offer global opportunities while maintaining a high quality of life.
Free healthcare, excellent universities, and breathtaking natural landscapes make Canada appealing for families, students, and professionals alike. For many, it strikes a rare balance between opportunity, safety, and cultural inclusivity.
Still, Canada has its challenges. Housing costs in cities like Toronto and Vancouver are among the highest in North America, and winters can be long and harsh, especially in the central and eastern provinces. Despite this, Canada’s stable economy, progressive immigration policies, and multicultural society keep it firmly in the top ten destinations worldwide.
Residency Pathways
- Express Entry and Provincial Nominee Programs for skilled workers
- Family sponsorships
- Student visas with post-graduation work options
- Start-up visa and entrepreneur programs
Living Snapshot
A one-bedroom apartment in Toronto or Vancouver averages €1,600–2,100, while smaller cities like Calgary or Halifax are closer to €1,000–1,300. Monthly living costs for a single person in Canada range from €2,000 to €2,500.
Canada is officially bilingual (English and French), but English dominates in most provinces, with French central in Quebec. This mix offers expats both accessibility and the option to embrace a second language.
 Israel

Resilience, Innovation, and Community
Despite persistent security challenges, Israel ranks #8 in the 2025 World Happiness Report, driven by a high-tech "Silicon Wadi" economy and deep social cohesion.
While residents navigate an exceptionally high cost of living and a high-stress environment, these factors are balanced by a world-class healthcare system and a resilient, community-focused Mediterranean lifestyle.
Residency Pathways
- Law of Return (Aliyah): Immediate citizenship for those with Jewish heritage.
- B/1 Work Visa: For foreign experts in specialised fields, requiring a minimum monthly salary of NIS 27,132 in 2026.
- A/5 Temporary Residence: Often granted during the process of marriage or cohabitation with an Israeli citizen.
- Digital Nomad Options: While not a formal visa category, many tech professionals work remotely on extended B/2 visitor status.
Living Snapshot
Rent for a one-bedroom apartment in Tel Aviv is among the most expensive globally, typically ranging from €1,800 to €2,700 ($2,000–$3,000), while Haifa or Be'er Sheva offers more affordable options at €900 to €1,400.
Living costs are high; a single person typically needs a budget of at least €2,900–€3,800 ($3,200–$4,200) to live comfortably in a major city. While Hebrew is the primary language, English is very widely spoken, particularly in business and high-tech sectors.
 Costa Rica

Pura Vida and Tropical Well-being
Costa Rica consistently ranks among the happiest countries in the Americas, often placing in the global top 15 in the World Happiness Report. Known for its "Pura Vida" philosophy, it offers a lifestyle centred around community, biodiversity, and outdoor adventures.
The trade-offs include rising import costs, occasional administrative bureaucracy, and a tropical climate that requires an adjustment period.
Residency Pathways
- Rentista Visa: For those with a guaranteed monthly income of $2,500 for two years.
- Pensionado Visa: For retirees with a lifetime pension of at least $1,000 per month.
- Digital Nomad Visa: Allows remote workers to stay for one year (extendable) with a $3,000 monthly income requirement.
- Investor Visa: Requires a minimum investment of $150,000 in real estate or business.
Living Snapshot
Rent for a 1-bedroom apartment in decent areas ranges from €650 to €1,100 ($700–$1,200). Monthly living costs for a single person average €1,400–€1,700, though imported goods can significantly inflate grocery budgets.
 Austria

Cultural Heritage and Alpine Stability
Austria offers an elite standard of living, characterised by historical grandeur, world-class public transportation, and a deep-seated appreciation for art and alpine nature.
Vienna consistently ranks among the most liveable cities globally due to its housing stability and safety.
The trade-offs are a more formal social culture and a complex bureaucracy for non-EU nationals. Yet, the high level of security and access to European travel make it a top-tier choice for professionals and retirees.
Residency Pathways
- Red-White-Red Card: A points-based system for highly skilled workers.
- Settlement Permit (Non-Gainful): For individuals with sufficient funds who do not intend to work in Austria.
- Student Visas: Widely accessible for international students at public universities.
- EU Blue Card: Available for high-salary professionals in shortage occupations.
Living Snapshot
A 1-bedroom apartment in Vienna averages €800 to €1,200. Monthly living costs for a single person are approximately €1,600–€2,100, benefiting from highly subsidised public transport.
 New Zealand

Adventure, Safety, and Kiwi Pace
New Zealand provides an unmatched quality of life for those who value rugged natural beauty and a relaxed "Kiwi" pace. It is a global leader in work-life balance, offering a safe, family-orientated environment with strong environmental protections.
The trade-offs involve geographical isolation, high grocery prices due to import reliance, and a competitive rental market in cities like Auckland.
Residency Pathways
- Skilled Migrant Category: Points-based residency for workers in high-demand sectors.
- Green List Work to Residence: Fast-track for specific roles in healthcare, tech, and engineering.
- Active Investor Plus Visa: For high-net-worth individuals investing in New Zealand businesses.
- Working Holiday Visa: For young adults (18–30 or 18–35 depending on citizenship) from partner countries.
Living Snapshot
1-bedroom apartments in Auckland or Wellington range from €1,100 to €1,650. A single person typically budgets €1,700–€2,300 monthly, with fuel and electricity being significant expenses.
 Belgium

EU Heart, Healthcare, and Social Safety
Belgium is the diplomatic heart of Europe, offering a high standard of living, world-class healthcare, and a rich culinary and cultural scene. Its central location makes it an ideal hub for professionals working within the EU or international NGOs.
The trade-offs are heavy traffic in Brussels and a complex linguistic divide between the Dutch-speaking North and French-speaking South.
Nevertheless, its affordable public transit and robust social security system provide a strong sense of safety and predictability.
Residency Pathways
- Work Permit (Single Permit): For employees with a valid job offer and specific salary thresholds.
- Self-Employed Professional Card: For entrepreneurs wishing to start a business or practice.
- Family Reunification: For spouses or children of Belgian residents.
- EU Blue Card: For high-skilled workers with specialised qualifications.
Living Snapshot
1-bedroom apartments in Brussels range from €900 to €1,200. Monthly costs for a single person average €1,600–€1,900, with healthcare being notably affordable due to mandatory insurance.
Which Countries Are Best for Your Lifestyle?
Not every expat has the same priorities. Some want beaches and excellent Wi-Fi; others focus on family stability, affordable retirement, or top-tier universities.
Here are the destinations that stand out for different lifestyles.
Best Countries for Digital Nomads
Digital nomads thrive where the cost of living is manageable, the internet is reliable, and visa rules are flexible. These countries have become top picks for remote workers:
- Portugal – Affordable coastal living, vibrant Lisbon and Porto communities, and the D8 Digital Nomad Visa make it Europe’s hottest spot.
- Spain – A digital nomad visa (launched in 2023) plus sunny cities like Barcelona and Valencia offer the perfect mix of work and leisure.
- Thailand - budget-friendly, great coworking hubs in Bangkok and Chiang Mai, and a thriving expat community.
- Mexico is popular for its culture, food, and coastal hotspots like Playa del Carmen, making the Temporary Resident Visa a big plus.
- Bali (Indonesia) – Famous for its creative expat scene, surf culture, and affordable villas, with long-stay visa options making it accessible.
Best Countries for Families
Families moving abroad look for safety, strong education, healthcare, and a healthy work–life balance. These countries consistently deliver:
- Nordic countries (Finland, Denmark, Sweden, and Norway) - Generous parental leave, free education, top childcare systems, and some of the safest societies in the world.
- Canada – Welcoming newcomers, with free healthcare, excellent schools, and a multicultural environment that makes integration smooth.
- Portugal – has a family-friendly pace of life, a warm climate, and is affordable compared to much of Western Europe.
- New Zealand – is great for outdoorsy families, with excellent schools, low crime rates, and a relaxed lifestyle.
Best Countries for Retirees
Retirees often seek a mix of affordability, excellent healthcare, and a slower pace of life. These destinations stand out:
- Panama – Famous for its pensionado program, offering tax breaks and discounts for retirees, plus warm weather year-round.
- Portugal – Reliable healthcare, welcoming communities, and tax incentives under certain residency programs make it a European favourite.
- Costa Rica – The “Pura Vida” lifestyle, excellent healthcare, and a large expat community create a stress-free retirement setting.
- Malaysia – Affordable living, modern healthcare, and the Malaysia My Second Home (MM2H) program attract retirees from all over.
Best Countries for Students
Students abroad look for world-class universities, affordability, and clear pathways to stay after graduation. These countries lead the way:
- Germany – Renowned for free or low-cost tuition, strong research institutions, and a vibrant international student scene.
- United States – Home to Ivy League and top-ranked universities, with unmatched academic and networking opportunities.
- United Kingdom – Prestigious universities like Oxford and Cambridge, plus the Graduate Route visa for post-study work.
- Canada – Affordable compared to the US/UK, with excellent universities and post-graduation work permits.
- Australia – Popular for international students thanks to high-quality universities, a vibrant multicultural society, and work opportunities after study.
Best Countries for Affordable but Liveable
Not everything wonderful comes with sky-high costs. These destinations strike a balance between affordability and quality of life:
- Portugal – Low living costs for Western Europe, excellent climate, and strong expat communities.
- Spain – Affordable housing outside big cities, a relaxed lifestyle, and accessible healthcare.
- Hungary – Budapest offers historic charm, good infrastructure, and lower costs than most of the EU.
- Thailand – Cheap housing, amazing food, and well-established expat hubs in Bangkok and Chiang Mai.
- Costa Rica – Affordable tropical living with good healthcare and a welcoming expat culture.
Frequently Asked Questions About the Best Countries to Live In
Conclusion
Choosing where to live is never just about statistics or rankings; it’s about aligning your own goals with the qualities that make a country feel like home. The top countries in the world report well on happiness, life expectancy, safety, and overall score, but the best choice for you depends on whether you value employment opportunities, healthcare, cultural influence, or affordability most.
Recently, numerous nations in Europe, the European Union, the Middle East, and beyond have achieved top rankings in various categories, which demonstrates that there is no universally applicable solution. What matters is understanding the data, comparing it against your personal needs, and making a decision that supports a positive quality of life in the long term.
With so many great places to consider, from established European nations to emerging lands improving their scores year after year, the real opportunity lies in finding a destination that not only offers stability and opportunity but also feels right for you, your family, and your future.